Develop a catalogue of market data cost saving and optimization initiatives
The catalogue, the associated opportunities to reduce costs and to right-size the provision of market data services across the firm, will contain streams that have proven successful during projects carried out by the consultants of MDS at Work during the last 20 years.
Our approach
Review your market data spend and cost drivers
- Market data inventory – Products & Services
- Vendor contracts – Terms & Conditions
- Usage
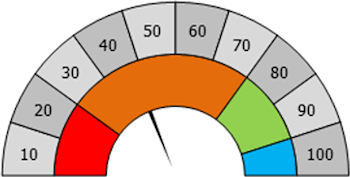
Example
Bloomberg terminal distribution

Good: most buy-side firms are having more expensive Bloomberg terminals to manage their assets.
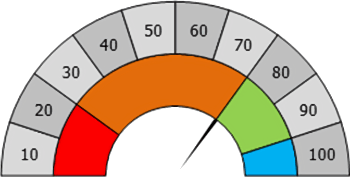
FactSet terminal distribution
Average: large number of FactSet Workstations, favorable cost per user, but limiting the potential for further terminal cost reductions.
Data feeds
Average-Good: in general the number of data feed providers at buy-side firms is between 3-5.
Credit Rating Agencies

Good: cost is lower than compared to peers.
Define catalogue of cost saving and optimization initiatives
| Project Stream | Total net spend p.a. |
% | Minimum range |
% | Maximum range |
|---|---|---|---|---|---|
| Market Data Terminal Landscape Optimization |
€ 7.900.000 | 5% | € 395.000 | 20% | € 1.580.000 |
| Market data feeds: pricing and reference data |
€ 2.850.000 | 5% | € 142.500 | 10% | € 285.000 |
| Exchange fees | € 570.000 | 5% | € 28.500 | 15% | € 85.500 |
| Research subscriptions: CRAs and brokers | € 765.000 | 5% | € 38.250 | 15% | € 114.750 |
| Specialist data & news services | € 149.000 | 15% | € 22.350 | 30% | € 44.700 |
| Broker data | € 295.000 | 10% | € 28.026 | 20% | € 59.000 |
| Total | € 12.529.000 | 5% | € 645.626 | 17% | € 2.168.950 |
Implement selected optimization initiatives
With years of experience MDS at Work consultants are in a good position to support your organization with the implementation of optimization initiatives. Execution of savings initiatives will lead to sustained savings over time. It is important to include these initiatives as part of the annual plan.